

ESG data
We have posted the data on the ESG of MUFG.
Environmental Data
Social Data
Reducing Our Environmental Impacts through Core Business
Environmental Accounting: Reducing CO2 and
Achieving Economic Effects through Loans
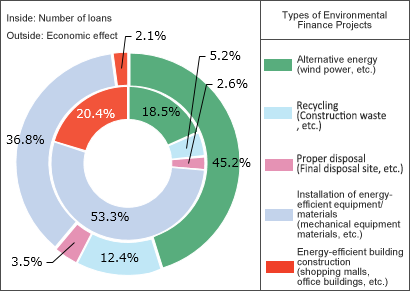
Financing making use of the Japanese government's interest rate subsidy program targets a diverse range of items, such as the installation of generating equipment powered by solar, wind and other types of renewable energy; air conditioning equipment at factories and office buildings; lighting and other energy-saving equipment and materials; energy-conscious construction; and a variety of waste disposal and treatment facilities, including industrial waste recycling facilities, melting furnaces and final-treatment plants. MUFG Bank provides support for customers' environmentally conscious businesses and contributes indirectly to reducing their environmental impact.
[Fiscal 2019]
Loan projects
9
9
Annual CO2 reduction effect Approximately
1,700 tons
1,700 tons
Economic impact of CO2 reductions Cumulatively, approximately
¥5.7 billion
¥5.7 billion
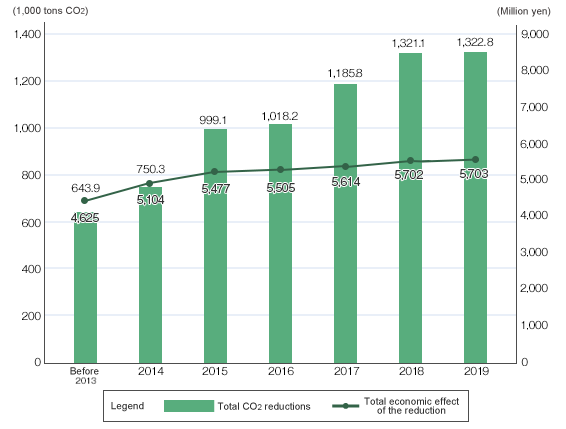
Total CO2 Reductions and Economic Effect through Financing
Ratio by Field of Number of Loans and Total Economic Effect according to CO2 Reduction (Cumulative values since FY2014)
Changes in CO2 Reductions and Economic Effect through Financing
| Item | Reduction unit cost | FY 2013 | FY 2014 | FY 2015 | FY 2016 | FY 2017 | FY 2018 | FY 2019 |
|---|---|---|---|---|---|---|---|---|
| Number of environmental loans, by fiscal year | No. of loans | 38 | 29 | 21 | 9 | 26 | 23 | 9 |
| Annual CO2 reductions due to financing, by fiscal year | 1,000 t-CO2 | 190.2 | 106.4 | 248.8 | 19.1 | 167.6 | 135.3 | 1.7 |
| Total CO2 reductions | 1,000 t-CO2 | 643.9 | 750.3 | 999.1 | 1,018.2 | 1,185.8 | 1,321.1 | 1,322.8 |
| Total economic effect of the reduction | million yen | 4,625 | 5,104 | 5,477 | 5,505 | 5,614 | 5,702 | 5,703 |
| Reduction unit cost (note) | yen/t-CO2 | 7,000 | 4,500 | 1,500 | 1,500 | 650 | 650 | 600 |
- The average cost of Excess Reductions is detailed in the "Results of the assessment of trading prices," a Tokyo Metropolitan Government survey on total reduction obligations and the emissions trading structure in the metropolitan area (March, 2020). This was used as a measure that could be equated with a reduction cost within Japan.
Reducing Our Environmental Impacts of Business Activities
Reductions in CO2 Emissions from Business Activities and Employee Travel
[Method of calculation for FY 2020]
- Period covered: April 1, 2020 through March 31, 2021
- Scope of Reporting: Includes five companies: Mitsubishi UFJ Financial Group, MUFG Bank, Mitsubishi UFJ Trust and Banking, Mitsubishi UFJ Morgan Stanley Securities, and Mitsubishi UFJ NICOS. Data for Mitsubishi UFJ Morgan Stanley Securities includes data for Mitsubishi UFJ Securities Holdings, with the exception company automobiles (gasoline).
- CO2 Emissions Calculation Method: (1) City gas, LPG, kerosene, light oil, heavy oil, steam/hot water, cold water, and gasoline are calculated according to factors based on the Act on Promotion of Global Warming Countermeasures; (2) Electricity is calculated according to the most recent basic emissions factors by electricity producers for FY 2017 based on the Act on the Promotion of Global Warming Countermeasures;
(3) Overseas travel (international routes) is calculated according to a factor specified in the General Guidelines on Supply Chain GHG Emission Accounting (Ministry of the Environment / Ministry of Economy, Trade and Industry). - CO2 emissions from use of electric power: this report contains the results of calculations based on the “basic emission factor (pre-adjustment emission factor)”, in which power companies do not reflect Kyoto Mechanism credits or cuts in domestic certified emissions, etc.
MUFG Environmental Impact Data and GHG Emissions
| Item (GRI Indicators) | Units | FY 2014 | FY 2015 | FY 2016 | FY 2017 | FY 2018 | FY 2019 | FY 2020(note) | ||
|---|---|---|---|---|---|---|---|---|---|---|
| Total floor space | 1,000 m2 | 2,223 | 2,222 | 2,175 | 2,174 | 2,175 | 2,167 | 2,049 | ||
| Direct energy consumption (EN3) | City gas | 1,000 Nm3 | 4,117 | 3,915 | 3,915 | 3,965 | 3,697 | 3,285 | 2,997 | |
| Heavy oil | kl | 911 | 882 | 855 | 962 | 805 | 856 | 1,005 | ||
| Kerosene | kl | 117 | 87 | 81 | 75 | 76 | 68 | 49 | ||
| Indirect energy consumption (EN4) | Electricity | 1,000 kWh | 424,222 | 399,733 | 409,823 | 397,386 | 381,211 | 395,463 | 369,073 | |
| Steam, hot water | GJ | 47,827 | 52,473 | 63,463 | 68,257 | 62,466 | 61,657 | 58,856 | ||
| Cold water | GJ | 45,931 | 46,143 | 55,836 | 56,213 | 61,828 | 57,148 | 49,779 | ||
| Energy use from employee travel and transportation (EN30) | Overseas travel (international routes) | 1,000 km | 50,843 | 53,968 | 56,568 | 52,672 | 52,359 | 36,280 | 64 | |
| Company automobiles (gasoline) | kl | 3,227 | 3,152 | 2,927 | 2,684 | 2,570 | 2,133 | 1,517 | ||
| Water usage efficiency (EN8) | Tap water | 1,000 m3 | 1,459 | 1,405 | 1,398 | 1,503 | 1,446 | 1,383 | 671 | |
| Waste water | 1,000 m3 | 1,197 | 1,152 | 1,155 | 1,176 | 1,208 | 1,154 | 479 | ||
| Carbon dioxide emissions |
Scope1 | Direct CO2 emissions (EN15) | t-CO2 | 11,947 | 11,344 | 11,421 | 11,836 | 10,795 | 9,963 | 9,555 |
| Scope2 | Indirect CO2 emissions (EN16) | t-CO2 | 230,004 | 209,604 | 212,282 | 202,004 | 186,870 | 184,287 | 161,554 | |
| Scope3 | Other indirect CO2 emissions (EN17) | t-CO2 | 11,713 | 11,792 | 11,487 | 10,598 | 10,309 | 7,959 | 3,526 | |
| Offsets using CDM credits | t-CO2 | - | - | -25,500 | 0 | 0 | 0 | 0 | ||
| Total | t-CO2 | 253,664 | 232,740 | 209,689 | 224,439 | 207,973 | 202,209 | 174,634 | ||
| Basic unit of CO2 emission (CO2 emissions per unit of floor space) | t-CO2/ 1,000 m2 |
114 | 105 | 96 | 103 | 96 | 93 | 85 | ||
| Basic unit of electricity use | kWh/m2 | 191 | 180 | 188 | 183 | 175 | 182 | 180 | ||
(note) Provisional number as of July 2021
Details of Scope
(t-CO2)
| Item | FY2014 | FY2015 | FY2016 | FY2017 | FY2018 | FY2019 | FY2020(note1) | |
|---|---|---|---|---|---|---|---|---|
| Direct CO2 emissions (Scope1) |
City gas | 9,182 | 8,731 | 8,897 | 9,036 | 8,420 | 7,472 | 6,709 |
| Heaby oil | 2,469 | 2,391 | 2,318 | 2,608 | 2,180 | 2,321 | 2,724 | |
| Kerosene | 296 | 222 | 206 | 192 | 194 | 170 | 123 | |
| subtotal | 11,947 | 11,344 | 11,421 | 11,836 | 10,795 | 9,963 | 9,555 | |
| Indirect CO2 emissions (Scope2) |
Electricity | 224,660 | 203,982 | 205,482 | 194,910 | 179,785 | 177,248 | 155,362 |
| Steam, hot water | 2,726 | 2,991 | 3,617 | 3,891 | 3,561 | 3,514 | 3,355 | |
| Cold water | 2,618 | 2,630 | 3,183 | 3,204 | 3,524 | 3,524 | 2,837 | |
| subtotal | 230,004 | 209,604 | 212,282 | 202,004 | 186,870 | 184,287 | 161,554 | |
| Other indirect CO2 emissions (Scope3) |
Overseas travel (international routes) | 4,220 | 4,479 | 4,695 | 4,372 | 4,346 | 3,011 | 5 |
| Company automobiles (gasoline) | 7,493 | 7,313 | 6,792 | 6,226 | 5,963 | 4,948 | 3,520 | |
| subtotal | 11,713 | 11,792 | 11,487 | 10,598 | 10,309 | 7,959 | 3,526 | |
| Offsets using CDM credits | 0 | 0 | -25,500 | 0 | 0 | 0 | 0 | |
| Total | 253,664 | 232,740 | 209,689 | 224,439 | 207,973 | 202,209 | 174,634 | |
(note1) Provisional number as of July 2021
- Numbers represented with "EN" are performance indices according to the G4 Sustainability Reporting Guidelines.
- In FY 2016, the total area of floor space occupied was 1,609,600 m2 for Mitsubishi UFJ Financial Group and MUFG Bank combined; 328,700 m2 for Mitsubishi UFJ Trust and Banking; 144,000 m2 for Mitsubishi UFJ Morgan Stanley Securities; and 92,600 m2 for Mitsubishi UFJ NICOS.
Environmental Accounting Information for Our Offices
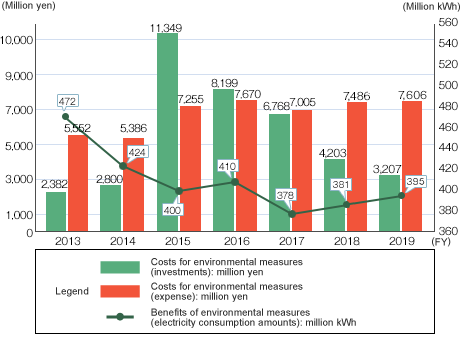
MUFG announces the results of environmental accounting, as part of environmentally conscious business activities, for the quantitative management of environmental efforts. Table 1 (Costs for Environmental Measures) presents the aggregate results for the costs for group environmental measures. MUFG measures and reports environmental impact data and greenhouse gas emissions quantities for all core group companies. Table 2 (Benefits of Environmental Measures) presents data regarding the benefits of these environmental measures, including the consumption of fuel, electricity and heat, and other factors, as well as CO2 emissions.
[Method of calculation for FY 2019]
- Period covered: April 1, 2019 through March 31, 2020
- Companies included: Core group companies (Mitsubishi UFJ Financial Group, MUFG Bank, Mitsubishi UFJ Trust and Banking, Mitsubishi UFJ Morgan Stanley Securities and Mitsubishi UFJ NICOS).
- Accounting method: Based on Environmental Accounting Guidelines 2005, published by Japanese Ministry of the Environment.
- As for the method of calculation, the depreciation expenses on investment amounts are included in expenses using the straight line method for a service life of five years (with no residual value). The service life is set at five years as the period during which repairs and improvements are required following the introduction of environmental equipment.
- As for standards for the posting of compound costs, items related to environmental preservation are calculated following Environmental Accounting Guidelines 2005, published by Japanese Ministry of the Environment.
Trends of Costs for Environmental Measures
(1) Cost for environmental measures
(Million yen)
| Category | Details | FY 2017 | FY 2018 | FY 2019 | Cost for environmental measures compared to FY 2018 |
|||||
|---|---|---|---|---|---|---|---|---|---|---|
| Investment | Expense | Investment | Expense | Investment | Expense | Investment | Expense | |||
| 1. Operation area costs | - | 6,768 | 6,903 | 4,203 | 7,380 | 3,207 | 7,500 | △996 | 119 | |
| Details | 1-1. Costs for pollution prevention | Costs for asbestos surveys, removal, measurement and inspection, etc. | 0 | 99 | 0 | 228 | 0 | 167 | 0 | △61 |
| 1-2. Costs for addressing global environmental issues | Investments: Installation of energy-efficient lighting and air conditioning equipment, etc. Costs: Depreciation for energy-efficient equipment, etc. |
6,768 | 6,441 | 4,203 | 6,783 | 3,207 | 6,908 | △996 | 124 | |
| 1-3. Costs for reuse of resources | Disposal of general and industrial waste | 0 | 363 | 0 | 369 | 0 | 425 | 0 | 56 | |
| 2. Upstream / downstream costs | - | 0 | 0 | 0 | 0 | 0 | 0 | 0 | 0 | |
| 3. Costs for management activities | Development/operation of environmental management systems, environmental information disclosure, etc. | 0 | 15 | 0 | 8 | 0 | 10 | 0 | 3 | |
| 4. Costs for research and development | - | 0 | 0 | 0 | 0 | 0 | 0 | 0 | 0 | |
| 5. Social activity costs | Charitable contributions related to environmental conservation, etc. | 0 | 86 | 0 | 98 | 0 | 96 | 0 | △3 | |
| 6.Environmental remediation costs | - | 0 | 0 | 0 | 0 | 0 | 0 | 0 | 0 | |
| Total | 6,768 | 7,005 | 4,203 | 7,486 | 3,207 | 7,606 | △996 | 119 | ||
| Category | Details | FY 2013 | FY 2014 | FY 2015 | FY 2016 | |||||
|---|---|---|---|---|---|---|---|---|---|---|
| Investment | Expense | Investment | Expense | Investment | Expense | Investment | Expense | |||
| 1. Operation area costs | - | 2,332 | 5,056 | 2,800 | 5,171 | 11,349 | 7,123 | 8,199 | 7,486 | |
| Details | 1-1. Costs for pollution prevention | Costs for asbestos surveys, removal, measurement and inspection, etc. | - | 235 | 0 | 178 | 0 | 188 | 0 | 242 |
| 1-2. Costs for addressing global environmental issues | Investments: Installation of energy-efficient lighting and air conditioning equipment, etc. Costs: Depreciation for energy-efficient equipment, etc. |
2,332 | 4,442 | 2,800 | 4,671 | 11,349 | 6,579 | 8,199 | 6,854 | |
| 1-3. Costs for reuse of resources | Disposal of general and industrial waste | - | 379 | 0 | 322 | 0 | 356 | 0 | 389 | |
| 2. Upstream / downstream costs | - | - | - | 0 | 0 | 0 | 0 | 0 | 0 | |
| 3. Costs for management activities | Development/operation of environmental management systems, environmental information disclosure, etc. | 50 | 345 | 0 | 138 | 0 | 26 | 0 | 74 | |
| 4. Costs for research and development | - | - | - | 0 | 0 | 0 | 0 | 0 | 0 | |
| 5. Social activity costs | Charitable contributions related to environmental conservation, etc. | - | 151 | 0 | 77 | 0 | 106 | 0 | 110 | |
| 6.Environmental remediation costs | - | - | - | 0 | 0 | 0 | 0 | 0 | 0 | |
| Total | 2,382 | 5,552 | 2,800 | 5,386 | 11,349 | 7,255 | 8,199 | 7,670 | ||
(2) Environmental benefits
| Category | Environmental performance indicators | Units | FY 2017 | FY 2018 | FY 2019 | Environmental benefits compared to FY 2018 |
|---|---|---|---|---|---|---|
| Environmental benefits related to resource inputs for business activities | City gas | 1,000 Nm3 | 3,965 | 3,697 | 3,285 | △412 |
| Heavy oil | kl | 962 | 805 | 856 | 52 | |
| Kerosene | kl | 75 | 76 | 68 | △8 | |
| Electricity | 1,000 kWh | 397,386 | 381,211 | 395,463 | 14,252 | |
| Steam, hot water | GJ | 68,257 | 62,466 | 61,657 | △809 | |
| Cold water | GJ | 56,213 | 61,828 | 57,148 | △4,680 | |
| Tap water | 1,000 m3 | 1,503 | 1,446 | 1,383 | △63 | |
| Energy consumption associated with road travel for executives and employees: company automobiles (gasoline) | kl | 2,684 | 2,570 | 2,133 | △437 | |
| The effects of environmental conservation efforts related to the environmental burden and waste emitted from our business activities | GHG emission | t-CO2 | 224,439 | 207,973 | 202,744 | △5,229 |
| Waste water | 1,000 m3 | 1,176 | 1,208 | 1,154 | △54 | |
| Other environmental benefits | Energy consumption associated with travel for executives and employees: air travel (international routes) | 1,000 km | 52,672 | 52,359 | 36,280 | △16,079 |
| Category | Environmental performance indicators | Units | FY 2013 | FY 2014 | FY 2015 | FY 2016 |
|---|---|---|---|---|---|---|
| Environmental benefits related to resource inputs for business activities | City gas | 1,000 Nm3 | 4,715 | 4,117 | 3,915 | 3,915 |
| Heavy oil | kl | 887 | 911 | 882 | 855 | |
| Kerosene | kl | 88 | 117 | 87 | 81 | |
| Electricity | 1,000 kWh | 471,881 | 424,222 | 399,733 | 409,823 | |
| Steam, hot water | GJ | 35,691 | 47,827 | 52,473 | 63,463 | |
| Cold water | GJ | 25,643 | 45,931 | 46,143 | 55,836 | |
| Tap water | 1,000 m3 | 1,995 | 1,459 | 1,405 | 1,398 | |
| Energy consumption associated with road travel for executives and employees: company automobiles (gasoline) | kl | 3,174 | 3,227 | 3,152 | 2,927 | |
| The effects of environmental conservation efforts related to the environmental burden and waste emitted from our business activities | GHG emission | t-CO2 | 299,228 | 253,664 | 232,740 | 209,689 |
| Waste water | 1,000 m3 | 1,702 | 1,197 | 1,152 | 1,155 | |
| Other environmental benefits | Energy consumption associated with travel for executives and employees: air travel (international routes) | 1,000 km | 78,465 | 50,843 | 53,968 | 56,568 |
Social Data - Employee-related Data
Status of Employees (new criteria)
| FY 2014 | FY 2015 | FY 2016 | FY 2017 | FY 2018 | FY 2019 | ||
|---|---|---|---|---|---|---|---|
| MUFG Bank | Number of employees(note1) | 35,214 | 34,865 | 34,276 | 34,101 | 33,524 | 32,186 |
Of these, overseas local hires |
5,619 | 5,758 | 5,781 | 5,800 | 5,669 | 5,840 | |
| Contract employees | 1,891 | 1,730 | 1,641 | 1,609 | 1,562 | 1,501 | |
| Temporary employees(note2) | 12,356 | 12,244 | 11,973 | 11,347 | 11,119 | 10,300 | |
| Average age(note3) | 38 yrs.1 mo. | 37 yrs.10 mo. | 37 yrs.11 mo. | 37 yrs.6 mo. | 38 yrs.2 mo. | 39 yrs.7 mo. | |
| Average years of continuous service(note3) | 14 yrs.9 mo. | 14 yrs.6 mo. | 14 yrs.6 mo. | 14 yrs.1 mo. | 14 yrs.8 mo. | 15 yrs.2 mo. | |
| Mitsubishi UFJ Trust and Banking | Number of employees(note4) | 6,879 | 6,963 | 6,959 | 7,011 | 6,457 | 6,397 |
Of these, contract salespersons |
563 | 686 | 603 | 534 | 468 | 443 | |
Of these, overseas local hires |
289 | 382 | 407 | 392 | 388 | 388 | |
| Temporary employees | 1,621 | 1,755 | 1,804 | 1,785 | 1,582 | 1,538 | |
| Average age(note5) | 41 yrs.4 mo. | 42 yrs.11 mo. | 42 yrs.9 mo. | 42 yrs.9 mo. | 42 yrs.10 mo. | 42 yrs.9 mo. | |
| Average years of continuous service(note5) | 16 yrs.6 mo. | 15 yrs.7 mo. | 15 yrs.10 mo. | 16 yrs.2 mo. | 16 yrs.7 mo. | 16 yrs.8 mo. | |
| Mitsubishi UFJ Morgan Stanley Securities | Number of employees | 4,918 | 5,174 | 5,226 | 5,204 | 5,273 | 5,401 |
Of these, overseas local hires(note6) |
0 | 0 | 0 | 0 | 0 | 0 | |
| Temporary employees | Avg.424 | Avg.459 | Avg.400 | Avg.288 | Avg.222 | Avg.192 | |
| Average age | 40 yrs.10 mo. | 40 yrs.9 mo. | 40 yrs.9 mo. | 41 yrs.1 mo. | 41 yrs.6 mo. | 41 yrs.11 mo. | |
| Average years of continuous service | 13 yrs.5 mo. | 13 yrs.4 mo. | 13 yrs.5 mo. | 13 yrs.11 mo. | 14 yrs.4 mo. | 14 yrs.8 mo. | |
| Mitsubishi UFJ NICOS | Number of employees(note7) | 3,286 | 3,331 | 3,402 | 3,181 | 3,111 | 3,059 |
| Average age | 40 yrs.0 mo. | 40 yrs.2 mo. | 40 yrs.2 mo. | 40 yrs.1 mo. | 40 yrs.6 mo. | 41 yrs.0 mo. | |
| Average years of continuous service | 15 yrs.5 mo. | 15 yrs.8 mo. | 16 yrs.0 mo. | 16 yrs.1 mo. | 16 yrs.6 mo. | 17 yrs.1 mo. | |
| ACOM | Number of employees(note8) | 1,851 | 1,892 | 1,854 | 1,936 | 2,020 | 2,063 |
| Temporary employees(note9) | 172 | 144 | 161 | 116 | 113 | 84 | |
| Average age | 39 yrs.11 mo. | 39 yrs.7 mo. | 39 yrs.11 mo. | 40 yrs.0 mo. | 40 yrs.5 mo. | 40 yrs.8 mo. | |
| Average years of continuous service | 15 yrs.0 mo. | 14 yrs.10 mo. | 15 yrs.2 mo. | 14 yrs.11 mo. | 14 yrs.5 mo. | 14 yrs.10 mo. | |
- Does not include executive officers, excludes MUFG Bank (the Bank) employees seconded to other companies, includes employees of other companies seconded to the Bank.
- Includes temporary staff.
- Excludes employees hired by overseas subsidiaries and employees of other companies seconded to the Bank.
- Does not include executive officers.
- Excludes executive officers, employees seconded from other companies and employees hired by overseas subsidiaries.
- Employees hired by the Beijing office.
- Does not include executive officers and seconded employees.
- Regular employees (including advisors and executive officers) and regular employees fixed to workplaces. Excluded employees seconded from the Company but includes those seconded to the Company.
- Average number of people employed during the year on fixed-term contracts (associate employees and temporary employees)
Number of Hires(note1)
| FY 2014 | FY 2015 | FY 2016 | FY 2017 | FY 2018 | FY 2019 | ||
|---|---|---|---|---|---|---|---|
| MUFG Bank(note2) | Main Career Track | 551 | 515 | 441 | 388 | 608 | 346 |
| Main Career Track (specific) |
321 | 316 | 320 | 226 | - | - | |
| Business-Specialist Track | 724 | 560 | 445 | 403 | 350 | 167 | |
| Total | 1596 | 1391 | 1206 | 1017 | 958 | 513 | |
| Mitsubishi UFJ Trust and Banking | Track G | 162 | - | - | - | - | - |
| Track B | 109 | - | - | - | - | - | |
| Main Career Track | - | 238 | 223 | 135 | 177 | 195 | |
| Main career path | - | 99 | 80 | 94 | 72 | - | |
| Total | 271 | 337 | 303 | 229 | 249 | 195 | |
| Mitsubishi UFJ Morgan Stanley Securities | Main Career Track | 176 | 217 | 179 | 190 | 217 | 84 |
| Area-Specific Main Career Track | 84 | 79 | 83 | 43 | 30 | - | |
| Regional Track | 61 | 9 | 12 | 10 | 13 | 0 | |
| Total | 321 | 305 | 274 | 243 | 260 | 84 | |
| Mitsubishi UFJ NICOS | Main Career | 73 | 66 | 64 | 56 | 75 | 77 |
| Regular Service | 54 | 37 | 42 | 14 | 21 | 25 | |
| Total | 127 | 103 | 106 | 70 | 96 | 102 | |
| ACOM | Main Career Track | 62 | 76 | 49 | 58 | 81 | 65 |
| Employment in limited positions | 77 | 57 | 31 | 33 | 32 | 17 | |
| Total | 139 | 133 | 80 | 91 | 113 | 82 | |
- These join the company on April 1 each fiscal year (only new graduates).
- Using September 31 of the next fiscal year as a basis (fiscal 2016 data limited only to employees who joined in April)
Number of Employees Using Support Systems and Leave
| FY 2014 | FY 2015 | FY 2016 | FY 2017 | FY 2018 | FY 2019 | ||
|---|---|---|---|---|---|---|---|
| MUFG Bank | Childcare leave | 2,035 | 2,229 | 2,640 | 2,940 | 2,886 | 2,815 |
| (211 male) | (235 male) | (555 male) | (582 male) | (535 male) | (610 male) | ||
| Shorter work hours for childcare | 1,196 | 1,291 | 1,387 | 1,216 | 1,367 | 1,460 | |
| Nursing care leave | 223 | 298 | 365 | 429 | 517 | 643 | |
| (55 male) | (74 male) | (94 male) | (98 male) | (142 male) | (156 male) | ||
| Family care leave | 18 | 8 | 8 | 13 | 16 | 25 | |
| Relocation recruitment system | 112 | 111 | 149 | 147 | 170 | 178 | |
| Mitsubishi UFJ Trust and Banking | Childcare leave | 276 | 315 | 363 | 386 | 413 | 507 |
| (1 male) | (4 male) | (8 male) | (8 male) | (22 male ) | (106 male ) | ||
| Shorter work hours for childcare | 260 | 331 | 280 | 322 | 328 | 351 | |
| Subsidy for childcare expenses | 204 | 207 | 227 | 295 | 292 | 295 | |
| Use of maiden name | 293 | 324 | 336 | 386 | 434 | 485 | |
| Job Challenge system | 7 | 5 | 12 | 15 | 15 | 29 | |
| Mitsubishi UFJ Morgan Stanley Securities | Childcare leave | 159 | 161 | 218 | 282 | 233 | 286 |
| (21 male) | (17 male) | (57 male) | (119 male) | (83 male) | (121 male) | ||
| Shorter work hours for childcare | 122 | 128 | 143 | 177 | 143 | 147 | |
| Family care leave | 0 | 2 | 1 | 1 | 0 | 2 | |
| Relocation requests | 6 | 7 | 9 | 14 | 7 | 11 | |
| Mitsubishi UFJ NICOS | Childcare leave | 134 | 143 | 156 | 149 | 134 | 156 |
| (2 male) | (1 male) | (3 male) | (4 male) | (3 male) | (21 male) | ||
| Shorter work hours for childcare | 234 | 257 | 282 | 280 | 306 | 297 | |
| Nursing care leave | 38 | 34 | 42 | 46 | 58 | 80 | |
| Family care leave | 4 | 7 | 6 | 3 | 0 | 5 | |
Company Targets and Results for Female Representation in Managerial Positions
| Target(note) | Mar-2019 | Mar-2020 | ||
|---|---|---|---|---|
| MUFG Bank | Executive officer (number) |
3 | 2 | 4 |
| Managers(note2) (ratio to total managers) |
17% | 17.1% | 20.2% | |
| Other Managerial Staff (ratio to total managers) |
27% | 24.3% | 27.0% | |
| Mitsubishi UFJ Trust and Banking | Executive officer (number) |
1 | 1 | 2 |
| Managers(note2) (ratio to total managers) |
8% | 8.7% | 9.7% | |
| Other Managerial Staff (ratio to total managers) |
25% | 23.8% | 25.2% | |
| Mitsubishi UFJ Morgan Stanley Securities |
Executive officer (number) |
- | 2 | 3 |
| Managers(note2) (ratio to total managers) |
120 or more (Approx. 7%) |
97 (Approx. 6.1%) |
107 (Approx. 6.8%) |
|
| Other Managerial Staff (ratio to total managers) |
13% or more | 14.3% | 16.0% |
| Target(note1) | Mar-2017 | Mar-2018 | Mar-2019 | Mar-2020 | ||
|---|---|---|---|---|---|---|
| Mitsubishi UFJ NICOS | Managers and Team Leaders (Equivalent to Assistant Manager) |
At least 25% | 19.7% | 20.1% | 20.0% | 20.4% |
- The goal is to reach the end of March 2021.
(As of September 2020)