Financial Review for the Fiscal Year Ended March 31, 2015
Financial and Economic Environment
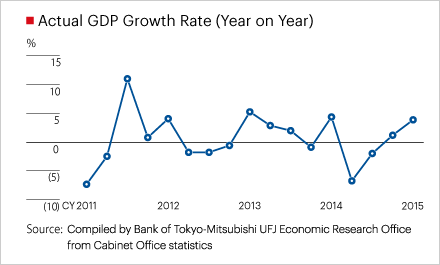
The global economy showed a gradual recovery during the fiscal year ended March 31, 2015, despite some events which increased financial and economic uncertainties, such as a sudden decrease in the oil price. The U.S. economy, led by domestic demand, maintained recovery momentum, reflecting an improvement in the employment environment, which caused the U.S. equity market to trend upward throughout the period. European countries kept struggling with fiscal and financial structural issues and the regional economy remained sluggish, although some signs of improvement can be observed recently. Asian countries showed stable economic growth reflecting strong consumer expenditures in the ASEAN (Association of South-East Asian Nations) countries, despite a slowdown in the Chinese economy.
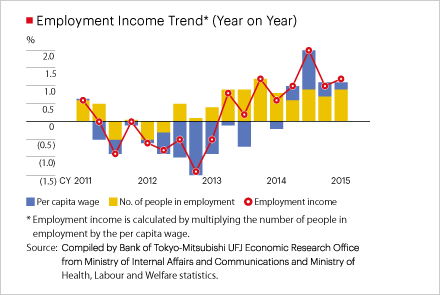
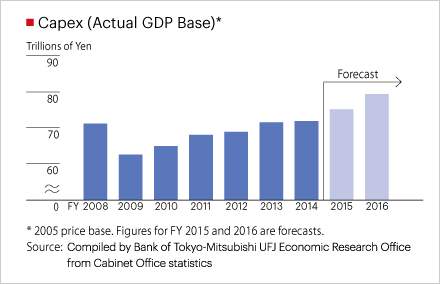
Amidst such conditions, the Japanese economy maintained a gradual recovery, overcoming the adverse impact of an increase in the consumption tax rate in April 2014. Private consumption in Japan, especially in the first half of the fiscal year ended March 31, 2015, was strongly affected by the higher tax rate, but its negative effect lessened towards the end of the fiscal year. Capital expenditure in Japan increased reflecting higher corporate earnings taking advantage of the depreciation of the Japanese yen against major currencies such as the U.S. dollar during the period.
The Federal Reserve terminated its asset purchase operations while keeping its policy rate at a historically low level. The European Central Bank further loosened its monetary policy by cutting policy rates, introducing negative interest rates on excess reserve balances deposited to the central banks, and beginning to purchase assets such as sovereign bonds issued by European countries, in order to tackle deflation risk in the region.
The Bank of Japan expanded its quantitative and qualitative easing measures in October 2014 in order to achieve its targeted inflation rate of 2%. In the circumstances, interest rates in Japan remained low during the period and hit a historically low level of below 0.2% in January 2015. The Japanese yen depreciated further against the U.S. dollar especially in the second half of the fiscal year ended March 31, 2015. The Japanese equity market remained firm and hit the ¥19,000 level, reflecting improvements in corporate earnings and the strong U.S. equity market.
Consolidated Earnings Summary
Consolidated Net Business Profits
Consolidated gross profits increased ¥475.5 billion from the previous fiscal year ended March 31, 2014, to ¥4,229.0 billion. The domestic deposit-loan margin decreased and there was also a reactive decline in equity commissions. However, this was covered by an increase in net interest income from overseas loan businesses and investment management; net fees and commissions from sales of investment products (mainly insurance, etc.); domestic exchange business and investment banking business; as well as a positive revenue impact of the consolidation of Bank of Ayudhya (¥244.7 billion).
General and administrative expenses increased ¥294.7 billion from the previous fiscal year ended March 31, 2014, to ¥2,584.1 billion. The main factors were an increase in overseas business expenses; the consumption tax hike; and the consolidation of Bank of Ayudhya (Krungsri) (¥136.9 billion). As a result, consolidated net business profits were ¥1,644.9 billion, an increase of ¥180.8 billion from the previous fiscal year ended March 31, 2014, (Bank of Ayudhya contributed ¥107.8 billion).
Credit Costs
Total credit costs increased ¥173.5 billion yen from the previous fiscal year ended March 31, 2014, to ¥161.6 billion. This was mainly due to an increase in credit costs at Bank of Tokyo-Mitsubishi UFJ (non-consolidated) and Mitsubishi UFJ Trust and Banking Corporation (nonconsolidated) on a rating downgrade for major clients, and increased costs (¥54.7 billion) on the consolidation of Bank of Ayudhya.
Net Gains (Losses) on Equity Securities
Net gains on equity securities fell ¥51.4 billion to ¥93.1 billion mainly due to a decrease in major gains on sales.
Ordinary Profits
Ordinary profits rose ¥18.1 billion to ¥1,713.0 billion on a rise of ¥47.1 billion in equity-method income to ¥159.6 billion (earnings increased at Morgan Stanley and Bank of Tokyo-Mitsubishi UFJ/Mitsubishi UFJ Trust and Banking Corporation equity-method affiliates) and an improvement in other non-recurring losses of ¥15.1 billion.
Net Income
Extraordinary income improved by ¥53.5 billion. Extraordinary losses of ¥98.2 billion were posted on Bank of Tokyo-Mitsubishi UFJ settlement payments in the United States (¥37.0 billion) and losses on change in equity (for Morgan Stanley, ¥33.2 billion, zero last fiscal year). However, this was covered by the stripping out of impairment of goodwill related to investments in Mitsubishi-UFJ Nicos (¥110.1 billion) in the fiscal year ended March 31, 2014.
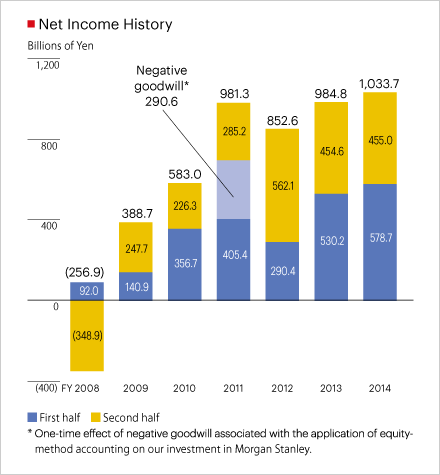
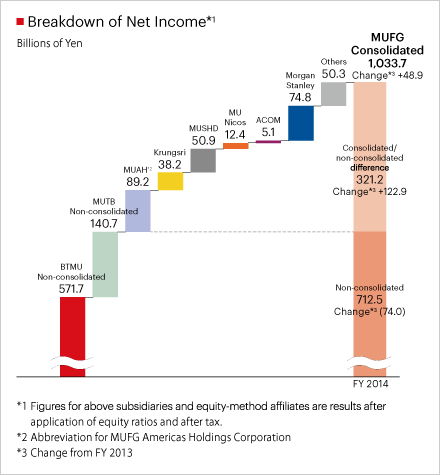
As a result, net income rose ¥48.9 billion to ¥1,033.7 billion. The difference between consolidated and nonconsolidated net income was ¥321.2 billion through contributions from all the major subsidiaries.
Net Operating Profits by Business Segment
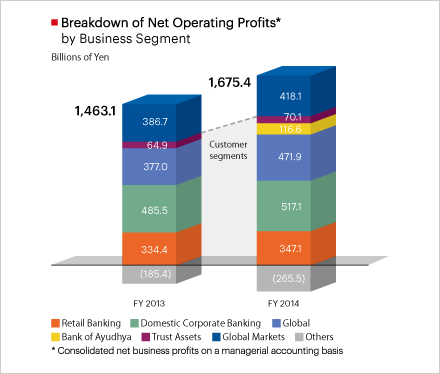
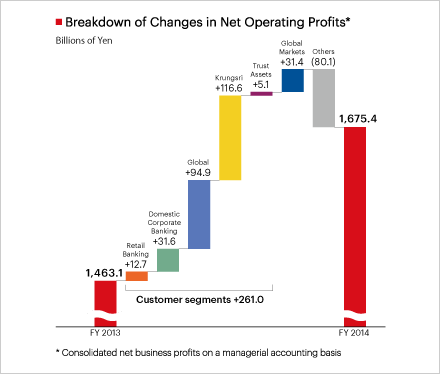
Consolidated net operating profits rose ¥212.4 billion to ¥1,675.4 billion due to increases in net business profits in all segments through the initiatives of the previous medium-term business plan as well as the consolidation of Bank of Ayudhya.
With regard to the net operating profits of customer segments, 39% of profits were earned from overseas business (note), an increase of 9 percentage points compared to the fiscal year ended March 31, 2014.
(note) Global Banking and Krungsri
Shareholder Returns
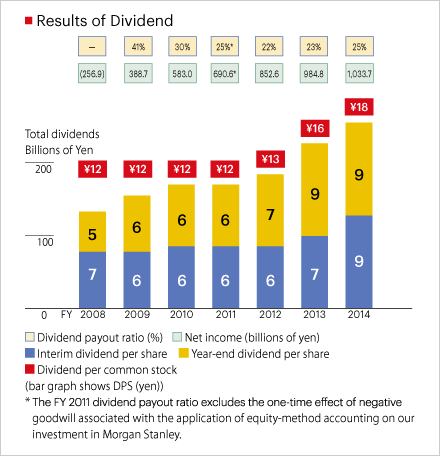
MUFG considers the return of earnings to shareholders to be one of the most important management priorities and makes it a basic policy to aim for a stable and continuous increase in dividends per share through growth in profits.
With respect to the year-end dividend for common stock for fiscal year 2014, MUFG plans to pay ¥9 per share. As a result, the annual dividend for fiscal 2014, including the interim dividend of ¥9 per share, is expected to be ¥18 per share, which is an increase of ¥2 from the annual dividend of ¥16 paid for the previous fiscal year.
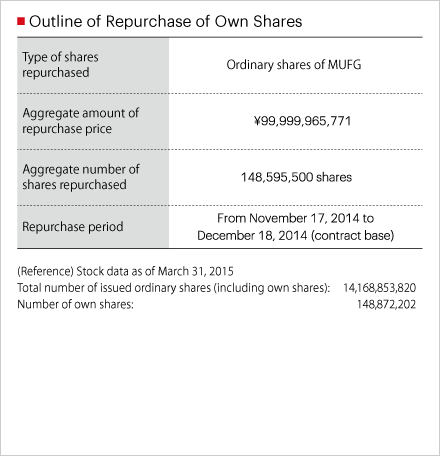
In the fiscal year ended March 31, 2015, we repurchased some of our own shares (¥99.9 billion) as part of our strategy to enhance returns to shareholders, improve ROE, and conduct capital management flexibly.
Consolidated Balance Sheet Summary
(Billions of Yen)
| Mar 31, 2015 |
Mar 31, 2014 |
Change from Mar 31, 2014 [% change] |
|
|---|---|---|---|
| Total assets | 286,149.7 | 258,131.9 | 28,017.8 [+10.9%] |
| Cash and due from banks | 40,488.3 | 23,969.8 | 16,518.4 |
| Loans (Banking accounts) | 109,368.3 | 101,938.9 | 7,429.4 |
| Domestic corporate loans (excluding loans to government) |
42,456.7 | 41,312.8 | 1,143.9 |
| Housing loans | 15,879.1 | 16,347.7 | (468.5) |
| Overseas loans | 41,043.5 | 33,907.0 | 7,136.4 |
| Investment securities | 73,538.1 | 74,515.5 | (977.3) |
| Domestic equity securities |
6,323.6 | 4,998.2 | 1,325.4 |
| Japanese government bonds |
35,210.6 | 40,649.9 | (5,439.2) |
| Foreign bonds | 23,571.5 | 21,431.8 | 2,139.6 |
| Goodwill | 309.1 | 552.6 | (243.5) |
| Total liabilities | 268,862.2 | 243,019.0 | 25,843.1 [+10.6%] |
| Deposits | 153,357.4 | 144,760.2 | 8,597.1 |
| BTMU and MUTB Combined |
137,332.3 | 132,121.6 | 5,210.6 |
| Individual deposits | 70,415.1 | 68,867.2 | 1,547.8 |
| Corporations and others |
47,449.1 | 45,724.5 | 1,724.5 |
| Overseas branches | 18,958.3 | 17,005.2 | 1,953.1 |
| Total net assets | 17,287.5 | 15,112.8 | 2,174.6 [+14.4%] |
| Total shareholders’ equity | 11,328.6 | 11,346.2 | (17.6) |
| Capital surplus | 1,428.4 | 2,174.3 | (745.9) |
| Retained earnings | 7,860.4 | 7,033.1 | 827.2 |
| Total accumulated other comprehensive income |
3,989.2 | 1,709.7 | 2,279.5 |
| Net unrealized gains (losses) on other securities |
2,835.0 | 1,218.3 | 1,616.6 |
| Foreign currency translation adjustments |
951.5 | 407.2 | 544.3 |
| Minority interests | 1,961.3 | 2,048.1 | (86.7) |
Net Assets
Shareholders’ equity fell ¥17.6 billion year on year to ¥11,328.6 billion on a rise in retained earnings balanced by dividend payments (¥263.9 billion); own share repurchase (¥100.0 billion); and repurchase and disposal of preferred shares (¥390.0 billion). Total accumulated other comprehensive income rose ¥2,279.5 billion to ¥3,989.2 billion on rises in net unrealized gains (losses) on other securities and foreign currency translation adjustments.
Loans
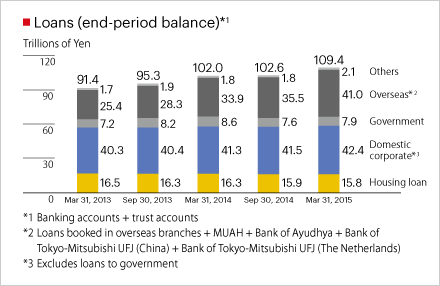
Loans increased ¥7,429.4 billion from the previous fiscal year ended March 31, 2014, to ¥109,368.3 billion on increases in domestic corporate and overseas loans.
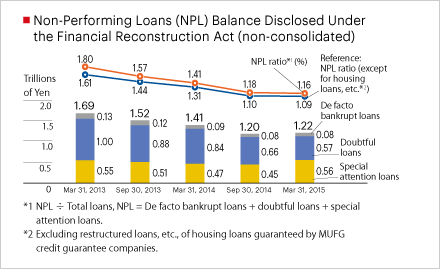
Although the non-performing loans (NPL) balance disclosed under the Financial Reconstruction Act rose slightly, the rise in credit costs meant that the NPL ratio fell 0.25 percentage points year on year to 1.16%.
Deposits
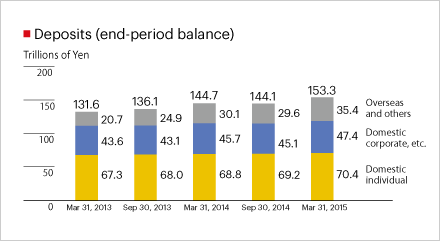
Deposits increased ¥8,597.1 billion from the previous fiscal year ended March 31, 2014, to ¥153,357.4 billion as domestic individual deposits, domestic corporate deposits and overseas deposits all rose.
Investment Securities
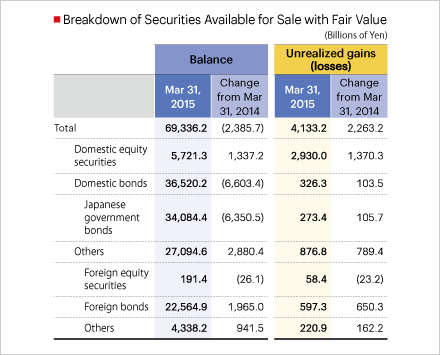
Investment securities fell ¥977.3 billion year on year to ¥73,538.1 billion, mainly due to a decrease in Japanese Government Bonds, while domestic equity securities and foreign bonds rose.
Net unrealized gains on available-for-sale securities rose ¥2,263.2 billion over the previous fiscal year to ¥4,133.2 billion on increases in domestic equity securities and foreign bonds.
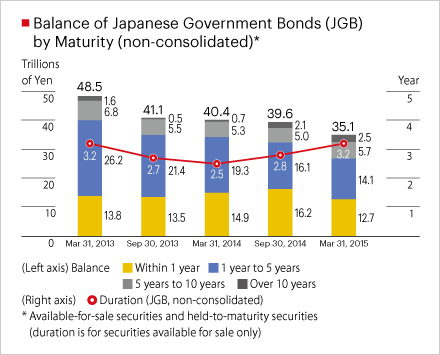
With regard to the balance of Japanese Government Bonds by maturity, those with five years or less decreased, while those with five years or more increased. Duration increased slightly to 3.2 years.
Capital Adequacy
(Billions of Yen)
| Mar 31, 2015 |
Sep 30, 2014 |
Change from Sep 30, 2014 |
|
|---|---|---|---|
| Common Equity Tier 1 Capital Ratio | 11.14% | 10.97% | 0.16% |
| Tier 1 Capital Ratio | 12.62% | 12.21% | 0.40% |
| Total Capital Ratio | 15.68% | 15.39% | 0.28% |
| Tier 1 Capital | 14,130.3 | 12,726.1 | 1,404.2 |
| Common Equity Tier 1 Capital | 12,466.6 | 11,435.8 | 1,030.8 |
| Capital and stock surplus | 3,569.9 | 3,580.9 | (11.0) |
| Retained earnings | 7,860.4 | 7,531.0 | 329.3 |
| Other comprehensive income |
1,595.7 | 448.6 | 1,147.0 |
| Additional Tier 1 Capital | 1,663.7 | 1,290.3 | 373.4 |
| Preferred stock, preferred securities and subordinated debt |
1,260.2 | 1,326.0 | (65.7) |
| Foreign currency translation adjustments |
570.9 | 203.3 | 367.5 |
| Tier 2 Capital | 3,421.9 | 3,313.0 | 108.9 |
| Subordinated debt | 1,944.9 | 2,039.9 | (95.0) |
| Amounts equivalent to 45% of unrealized gains on other securities |
1,108.5 | 997.3 | 111.2 |
| Total Capital (Tier 1+Tier 2) |
17,552.3 | 16,039.1 | 1,513.1 |
| Risk weighted assets | 111,901.5 | 104,160.1 | 7,741.3 |
| Credit risk | 98,292.2 | 88,530.0 | 9,762.2 |
| Market risk | 2,511.7 | 2,835.9 | (324.2) |
| Operational risk | 6,644.6 | 6,072.6 | 572.0 |
| Transitional floor | 4,452.8 | 6,721.5 | (2,268.6) |
Capital Adequacy
Common Equity Tier 1 Capital increased by ¥1,030.8 billion and total capital increased by ¥1,513.1 billion from the end of September 2014, mainly due to increases in retained earnings; foreign currency translation adjustments gains on the weaker yen; and net unrealized gains on other securities caused by the rise of the stock market.
Risk Weighted Assets (RWA)
RWA increased by ¥7,741.3 billion from the end of September 2014 mainly due to an increase in credit risk caused by the weaker yen and an increase in loans.
Risk-adjusted Capital Ratio
The Common Equity Tier 1 Capital Ratio was 11.14%, the Tier 1 Capital Ratio was 12.62% and the Total capital ratio was 15.68%. The provisional figure for the Common Equity Tier 1 Capital Ratio based on standards to be applied at end-March 2019 is 12.3%.
