Financial Review for Fiscal 2015
Financial and Economic Environment
In the fiscal year ended March 31, 2016, economy outlook has become increasingly clouded, even as the global economy — especially developed countries — remained on a gradual recovery course. Share prices around the world dropped owing to concerns surrounding China, weak oil and other resource prices. However, US domestic demand, in particular, remained on a path of self-sustained recovery as the employment picture steadily improved, despite weakness in the energy industry and some other sectors. Europe’s economy continued to pick up, propelled by the weak EUR and cheap oil, in spite of the Greek debt issue and NPLs in southern countries. In Asia, while China continued to slow due to suppressed investment, while weak exports weighed on other Asian economies, private consumption remained firm throughout the region, bolstered by lower inflation.
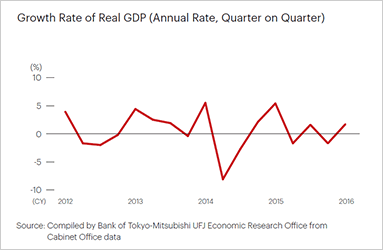
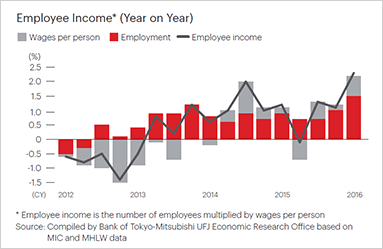
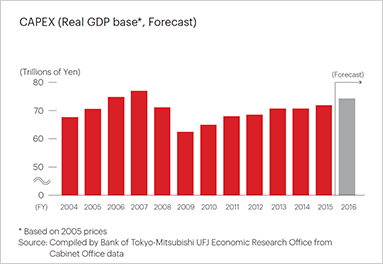
Against this backdrop, Japan’s economy continued on a gradual recovery trajectory, even with some apparent weak spots. The warm winter dampened private consumption, which remained fairly flat overall despite higher incomes. Exports to the US and Europe were strong overall, but exports to China and other emerging economies were weak, including resource-producing countries. On the other hand, capital expenditures continued to rise gradually due to robust corporate profits as the glut of capital stock was erased.
With regard to the financial situation, in U.S., the Federal Reserve Board raised interest rates for the first time in nine-and-a-half —years in December, as employment conditions improved. In the Eurozone, on the other hand, the ECB bolstered monetary easing, including cutting the deposit rate in December and again in March.
The Bank of Japan commenced a policy of “Quantitative and Qualitative Monetary Easing with a Negative Interest Rate” in January 2016, and the benchmark yield turned and stayed negative through to the end of the fiscal year. Share prices have fallen and the Japanese yen has rallied since early 2016, primarily reflecting heightened risk aversion around the globe.
Consolidated Earnings Summary
Consolidated Net Business Profits
Consolidated gross profits for the fiscal year ended March 31, 2016 decreased ¥85.8 billion from the previous fiscal year to ¥4,143.2 billion. This was mainly due to the appreciation of the Japanese yen against other currencies a decrease in net interest income from domestic loans and deposits and a fall in gains on ALM, whereas an increase in overseas profit from MUFG’s group collaboration businesses in the U.S. and overseas subsidiaries’ businesses contributed to increase gross profits.
General and Administrative expenses for the fiscal year ended March 31, 2016 increased ¥1.1 billion from the previous fiscal year to ¥2,585.2 billion, mainly due to higher regulatory costs in overseas despite MUFG’s cost-cutting efforts and the positive impact from the improved yen-dollar exchange rate. As a result, consolidated net business profits decreased ¥87.0 billion from the previous fiscal year to ¥1,557.9 billion.
Credit Costs
Total credit costs increased ¥93.5 billion from the previous fiscal year ended March 31, 2015, to ¥255.1 billion. This was mainly due to an increase in the provision for specific allowance for credit losses on the back of such factors as a fall in resource prices.
Net Gains (Losses) on Equity Securities
Net gains on equity securities fell ¥4.8 billion to ¥88.3 billion. This was mainly attributable to write-offs of equity securities, which outweighed an increase in gains on sales of equity securities.
Ordinary Profits
Ordinary profits fell ¥173.5 billion to ¥1,539.4 billion on a rise of ¥70.7 billion in profits from investments in affiliates to ¥230.4 billion that was mainly attributable to growth in earnings at Morgan Stanley and was partially offset by an increase in other non-recurring losses of ¥58.9 billion.
Profits Attributable to Owners of Parent
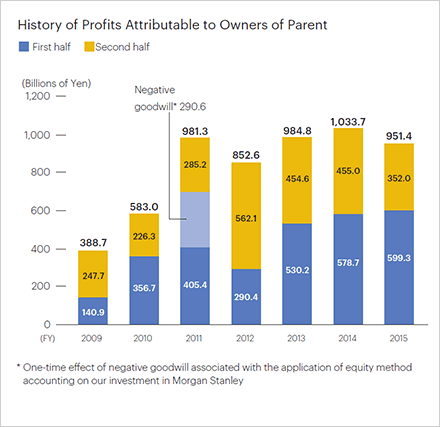
Net extraordinary losses decreased ¥57.5 billion from the previous fiscal year. Although a ¥40.7 billion loss was posted due mainly to losses on change in equity (in relation to Morgan Stanley; ¥36.0 billion), the improvement was largely attributable to the absence of legal settlement fees paid by The Bank of Tokyo-Mitsubishi UFJ in the United States in the previous fiscal year. As a result, profit attributable to owners of parent decreased ¥82.3 billion to ¥951.4 billion, somewhat exceeding the previously announced target of ¥950.0 billion.
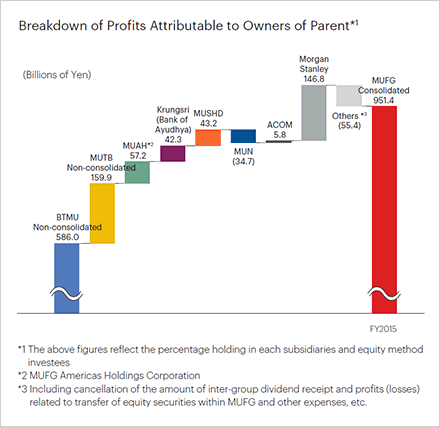
Net Operating Profits by Business Segment
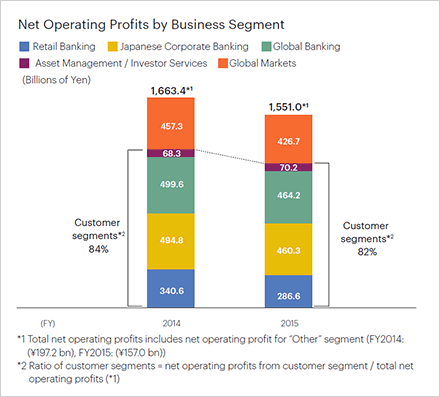
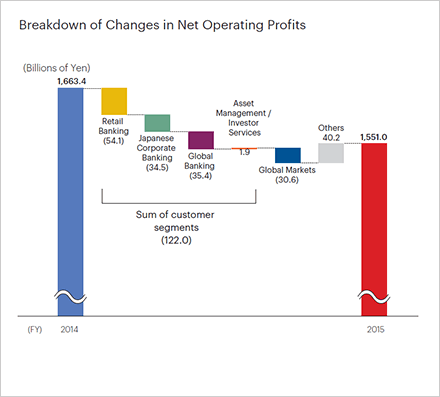
Consolidated net operating profits![]() fell ¥112.4 billion to ¥1,551.0 billion. Asset Management / Investor Services Business Group, profit increased mainly due to an increase in the value of assets under management both Japan and overseas. Meanwhile, in Retail Banking, Japanese Corporate Banking, Global Banking and Global Markets Business Groups, profits decreased due to the appreciation of yen, plunging stock markets and the low interest rate environment affected by Negative Interest Rate policy.With regard to the net operating profits in the customer segments, 36% of profits were earned from overseas business.
fell ¥112.4 billion to ¥1,551.0 billion. Asset Management / Investor Services Business Group, profit increased mainly due to an increase in the value of assets under management both Japan and overseas. Meanwhile, in Retail Banking, Japanese Corporate Banking, Global Banking and Global Markets Business Groups, profits decreased due to the appreciation of yen, plunging stock markets and the low interest rate environment affected by Negative Interest Rate policy.With regard to the net operating profits in the customer segments, 36% of profits were earned from overseas business.![]()
- *1 All figures are on managerial basis
- *2 Global Banking Business Group
Retail Banking Business Group
In Retail Banking Business Group, net operating profits decreased ¥54.1 billion to ¥286.6 billion for the fiscal year ended March 31, 2016. The customer base were expanded through the project of initial public offering involving the three Japan Post Group operating companies, and the consumer finance business contributed profits. However, a fall in revenues from the sale of investment products due to the deterioration in the market environment and a decrease in loan and deposit revenues resulting from lower interest margins, led to a net decrease in net operating profits for this segment.
Japanese Corporate Banking Business Group
In Japanese Corporate Banking Business Group, net operating profits decreased ¥34.5 billion to ¥460.3 billion for the fiscal year ended March 31, 2016. Large IPO project boosted revenues from securities business, while loans for SMEs grew thanks to the success of capital strategy proposals. Despite this, the absence of major M&A deals, which yielded significant revenues in the previous fiscal year, and a fall in interest income from loans and deposits due to the ongoing low interest rate environment, led to a net decrease in net operating profits.
Global Banking Business Group
In Global Banking Business Group, net operating profits decreased ¥35.4 billion to ¥464.2 billion for the fiscal year ended March 31, 2016. Although the M&A-related business posted firm results thanks to initiatives aimed at seizing opportunities arising from a trend toward reorganization among European and U.S. corporations, the segment was affected by the slowing pace of growth in the Chinese economy, a plunge in resource prices around the world and unfavorable foreign exchange rates, resulting in a net decrease in net operating profits.
Asset Management / Investor Services Business Group
In Asset Management / Investor Services Business Group, net operating profits increased ¥1.9 billion to ¥70.2 billion for the fiscal year ended March 31, 2016. This was mainly attributable to firm results recorded by the investment trust management services and growth in the value of assets managed in the global business, both of which helped counter the negative impact of a decline in employees’ pension fund plans.
Global Markets Business Group
In Global Markets Business Group, net operating profits decreased ¥30.6 billion to ¥426.7 billion for the fiscal year ended March 31, 2016. Despite the strong showings of S&T operations and the solid investment management revenues attributable to our taking a flexible approach to handling securities, a deceleration of Asia’s economic growth and extreme fluctuations in foreign exchange rates and stock markets led to a net decrease in net operating profits.
Consolidated Balance Sheet Summary
(Billions of Yen)
| Mar 31, 2016 |
Mar 31, 2015 |
Change from Mar 31, 2015 [% change] |
|
|---|---|---|---|
| Total assets | 298,302.8 | 286,149.7 | 12,153.1 [+4.2%] |
| Loans (Banking + Trust accounts) | 113,906.8 | 109,480.7 | 4,426.1 |
| Loans (Banking accounts) | 113,756.3 | 109,368.3 | 4,387.9 |
| Domestic corporate loans |
43,804.4 | 42,456.7 | 1,347.6 |
| Housing loans |
15,570.7 | 15,879.1 | (308.3) |
| Overseas loans |
43,045.4 | 41,701.7 | 1,343.7 |
| Investment securities | 69,993.8 | 73,538.1 | (3,544.3) |
| Domestic equity securities | 5,573.5 | 6,323.6 | (750.1) |
| Japanese government bonds | 28,357.1 | 35,210.6 | (6,853.5) |
| Foreign bonds | 27,883.7 | 23,571.5 | 4,312.1 |
| Total liabilities | 280,916.1 | 268,862.2 | 12,053.8 [+4.4%] |
| Deposits | 160,965.0 | 153,357.4 | 7,607.6 |
| BTMU and MUTB Combined | 145,331.9 | 137,332.3 | 7,999.6 |
| Individual (Domestic branches) |
71,068.6 | 70,415.1 | 653.4 |
| Corporations and others | 52,782.3 | 47,449.1 | 5,333.1 |
| Overseas branches | 21,062.4 | 18,958.3 | 2,104.0 |
| Total net assets | 17,386.7 | 17,287.5 | 99.2 [+0.5%] |
| Total shareholders’ equity | 11,855.8 | 11,328.6 | 527.1 |
| Retained earnings | 8,587.5 | 7,860.4 | 727.1 |
| Total accumulated other comprehensive income |
3,602.1 | 3,989.2 | (387.1) |
| Net unrealized gains (losses) on other securities |
2,486.6 | 2,835.0 | (348.4) |
| Foreign currency translation adjustments |
791.4 | 951.5 | (160.1) |
*1 BTMU and MUTB combined + Trust accounts
*2 Excluding loans to government and government institutions
*3 Loans booked in overseas branches, MUAH, Krungsri (Bank of Ayudhya), BTMU (China), BTMU (Holland), BTMU (Canada) and BTMU (Malaysia)
Net Assets
Shareholders’ equity grew ¥527.1 billion year on year to ¥11,855.8 billion on a rise in retained earnings and other positive factors that offset dividend payments (¥251.3 billion) and the repurchase of treasury stock (¥200.0 billion). Total accumulated other comprehensive income declined ¥387.1 billion to ¥3,602.1 billion due mainly to decreases in net unrealized gains (losses) on other securities and foreign currency translation adjustments.
Loans
Loans increased ¥4,426.1 billion from the previous fiscal year ended March 31, 2015, to ¥113,906.8 billion on increases in domestic corporate and overseas loans.
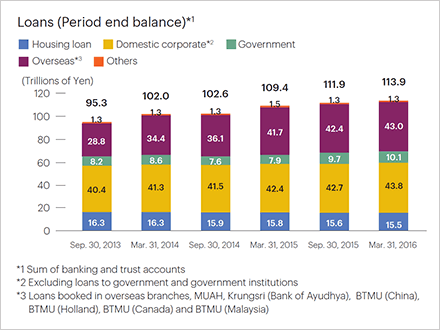
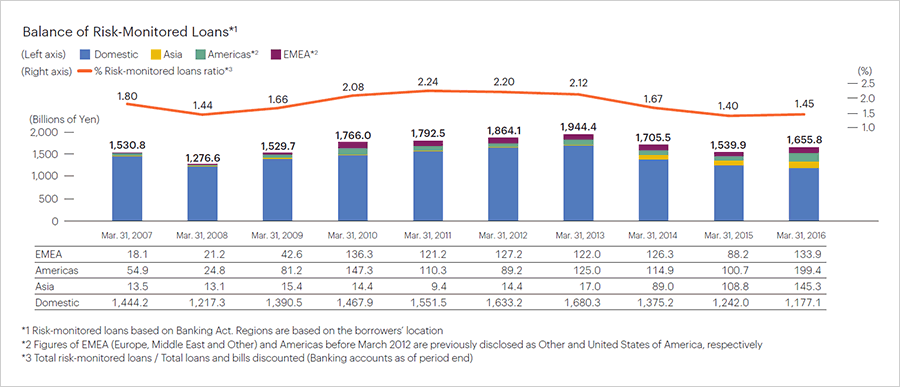
Although the risk-monitored loans based on Banking Act decreased in Japan, it increased overseas, especially in the Americas. As a result, the risk-monitored loans ratio increased 0.04 percentage points from the previous fiscal year ended March 31, 2015, to 1.45%.
Deposits
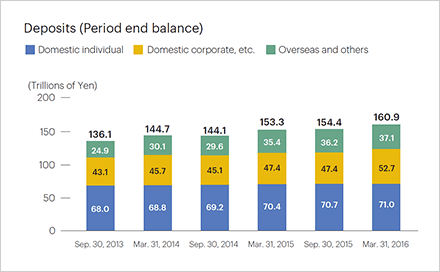
Deposits increased ¥7,607.6 billion from the previous fiscal year ended March 31, 2015, to ¥160,965.0 billion mainly due to an increase of domestic corporate deposits.
Domestic Deposit / Lending Rates
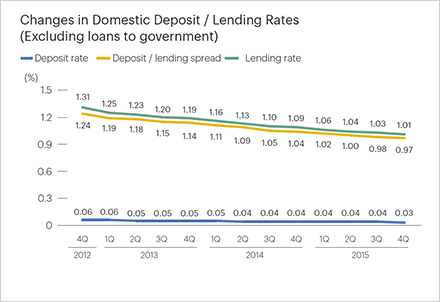
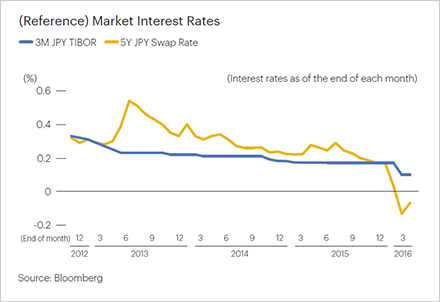
Domestic deposit / lending spread excluding loans to government decreased 0.07 percentage points from FY 2015 4Q mainly due to a decline in lending rates reflecting lower market interest rates.
Investment Securities
Despite an increase in foreign bonds, investment securities fell ¥3,544.3 billion year on year to ¥69,993.8 billion mainly due to a decrease in Japanese Government Bonds and domestic equity securities.
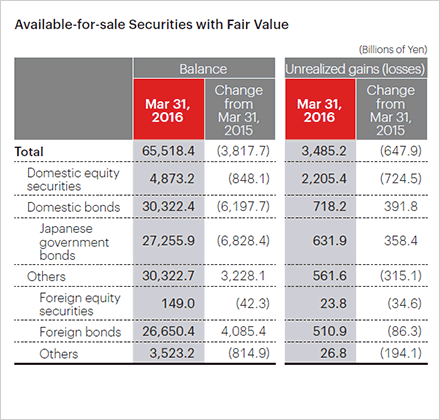
Net unrealized gains on available-for-sale securities fell ¥647.9 billion compared with the previous fiscal year to ¥3,485.2 billion due to a decrease in domestic equity securities.
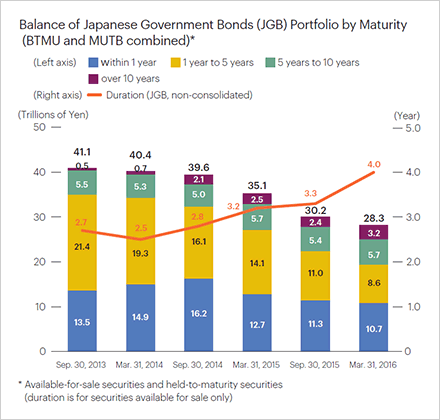
With regard to the balance of Japanese Government Bonds, by maturity, those due within five years or less were down due to such factors the low interest rate environment affected by Negative Interest Rate policy while those due within five years or more increased. Duration increased to 4.0 years.
Capital Adequacy
(Billions of Yen)
| Mar. 31, 2016 |
Sep. 30, 2015 |
Change from Sep. 30, 2015 |
|
|---|---|---|---|
| Common Equity Tier 1 Capital ratio | 11.63% | 11.23% | 0.40% |
| Tier 1 Capital ratio | 13.24% | 12.73% | 0.50% |
| Total Capital ratio | 16.01% | 15.69% | 0.31% |
| Tier 1 Capital | 14,839.2 | 14,254.1 | 585.1 |
| Common Equity Tier 1 Capital | 13,039.8 | 12,571.9 | 467.9 |
| Retained earnings | 8,587.5 | 8,358.0 | 229.5 |
| Other comprehensive income |
2,161.2 | 1,356.2 | 805.0 |
| Regulatory adjustments | (1,100.4) | (693.3) | (407.1) |
| Additional Tier 1 Capital | 1,799.4 | 1,682.2 | 117.1 |
| Preferred securities and subordinated debt |
1,544.5 | 1,260.2 | 284.2 |
| Foreign currency translation adjustments |
316.5 | 588.4 | (271.9) |
| Tier 2 Capital | 3,102.5 | 3,308.6 | (206.1) |
| Subordinated debt | 2,060.5 | 2,110.4 | (49.8) |
| Amounts equivalent to 45% of unrealized gains on available-for-sales securities |
633.8 | 838.3 | (204.5) |
| Total Capital (Tier 1+Tier 2) |
17,941.8 | 17,562.8 | 378.9 |
| Risk weighted assets | 112,064.3 | 111,925.3 | 139.0 |
| Credit risk | 95,372.3 | 95,274.0 | 98.2 |
| Market risk | 2,198.7 | 1,989.1 | 209.5 |
| Operational risk | 6,581.1 | 6,635.4 | (54.2) |
| Transitional floor | 7,912.1 | 8,026.6 | (114.4) |
* The risk-adjusted capital ratios and the amount of components thereof as of September 30, 2015 reflect corrections of errors discovered in the risk weighting applied to certain assets, mostly residential mortgage loans, and certain other adjustments made under Basel I standards to obtain amounts that were used for floor adjustments in determining the amounts of risk-weighted assets under Basel III standards.
Total Capital
Common Equity Tier 1 Capital increased by ¥467.9 billion and Total capital increased by ¥378.9 billion from the end of September 2015, mainly due to increases in retained earnings and other comprehensive income, as well as subordinated debt funding.
Risk Weighted Assets (RWA)
RWA was relatively unchanged, mainly due to an increase in loans balance, offset by a decrease in equity balance and the appreciation of the Japanese yen against the other currencies.
Risk-Adjusted Capital Ratio
The Common Equity Tier 1 Capital ratio was 11.63%, the Tier 1 Capital ratio was 13.24% and the Total Capital ratio was 16.01%. The provisional figure for the Common Equity Tier 1 Capital ratio, calculated on the basis of regulations applied at the end of March 2019, is 12.1%.
Shareholder Returns
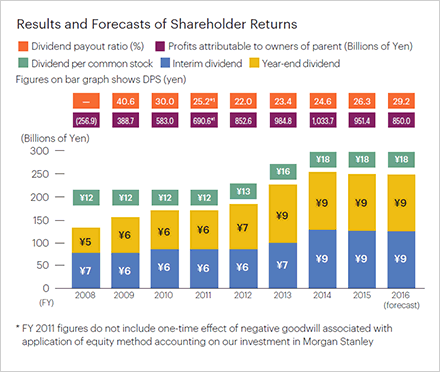
MUFG considers the return of earnings to shareholders to be one of the most important management priorities and makes it a basic policy to aim for a stable and continuous increase in dividends per share through growth in profits.
With respect to the year-end dividend for common stock for the fiscal year ended March 31, 2016, MUFG plans to pay ¥9 per share. As a result, the annual dividend for the fiscal year, including the interim dividend of ¥9 per share, is expected to be ¥18 per share, which is the same amount as the annual dividend of ¥18 paid for the previous fiscal year.
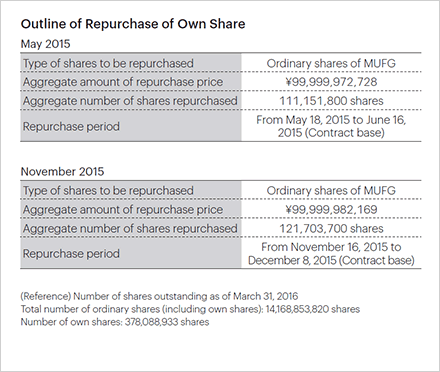
In the fiscal year ended March 31, 2016, we repurchased own shares on two occasions (approximately ¥100.0 billion each time) in May and November 2015 as part of our strategy to enhance shareholder returns, improve capital efficiency and conduct capital management flexibly.
Energy and Mining Credit Exposure
Credit Exposure
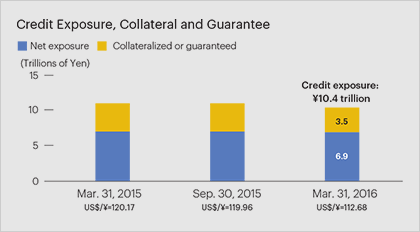
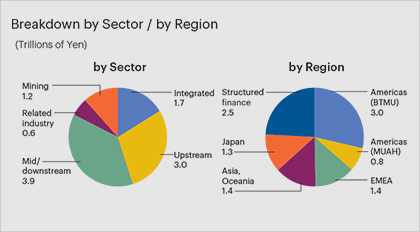
As of the end of March 2016, total credit exposure in the energy related sector, including oil, gas and mineral resources, was ¥10.4 trillion (¥6.2 trillion after deducting the undrawn commitment). Net exposure, deducting the collateral and guarantee (e.g., ECA), was ¥6.9 trillion.
Credit Quality
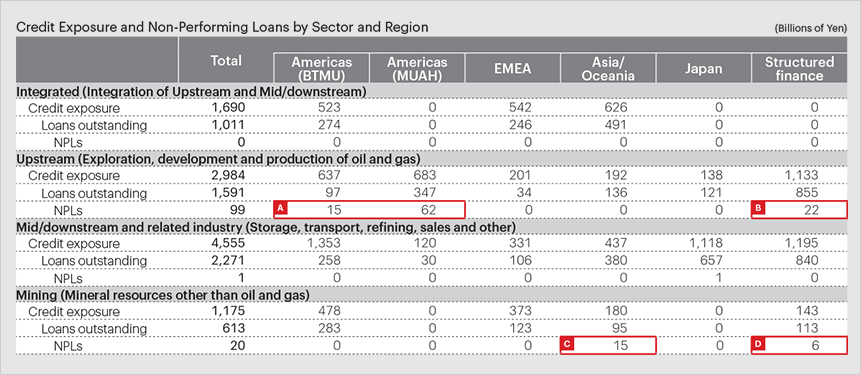
With regard to energy and mining credit exposure, more than 90% is categorized normal (borrowers classified as maintaining strong results and no particular problems with its financial position by the Inspection Manual for Deposit-Taking Institutions), while more than 60% is equivalent to investment grade. Credit deterioration has been observed principally in the upstream part of oil and gas related exposure, and in terms of regions, mostly in the Americas. Non-performing Loans (NLP) in the mining sector were incurred in Asia / Oceania and structured finance schemes. Total NPL amount is approximately ¥120 billion at March 31, 2016, of which 90% are covered with collateral, guarantee or allowance.

*1 Including undrawn commitment and excluding market exposure
*2 Subject to the relevant criteria applying to each subsidiary. For example, risk-monitored loans based on Japanese Banking Act
Note: All figures are on managerial basis
